
No products in the cart.

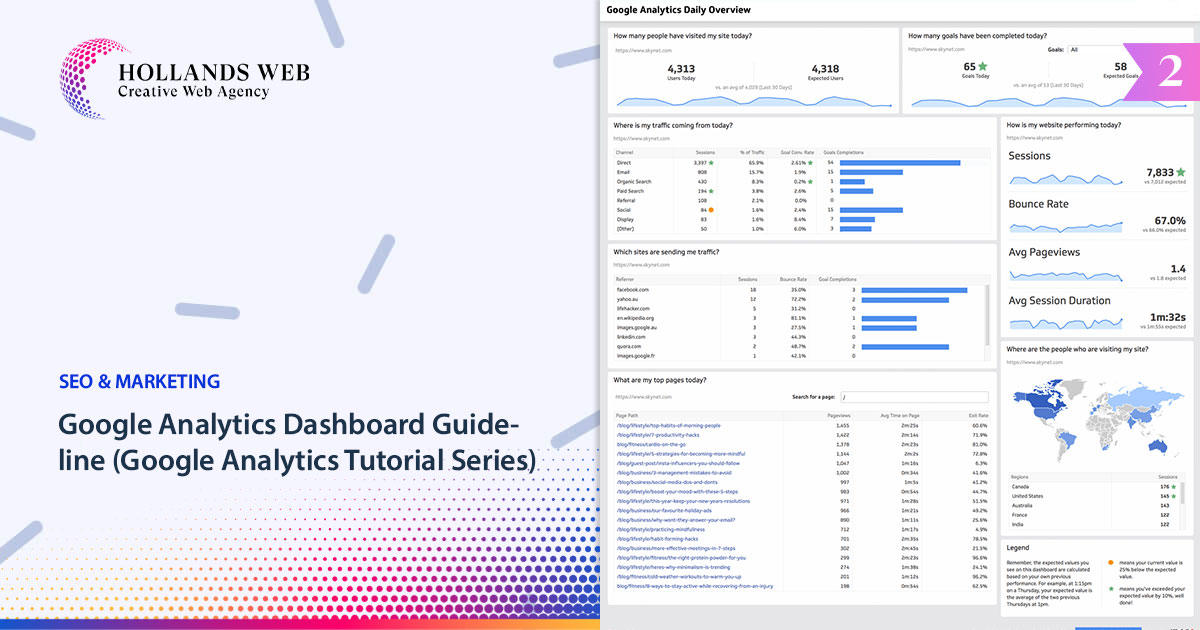
In the first article of this series, we talked about what is google analytics and how to create an account. So let’s start by understanding the Google analytic Dashboard.
A group of widgets that compile data from reports and present key performance indicators (KPI) in a visual manner. You may focus on various metrics and dimensions from several reports in one place using a Google Analytics dashboard.
A Google Analytics dashboard may be used to quickly assess the condition of your website and analyze patterns in the metrics over time. In summary, a Google Analytics dashboard enables you to use widgets to break down data into more manageable visualization categories. In your Google Analytics account, you can have up to 20 dashboards with 12 widgets each for each view or feature. A default dashboard is included with each view or property to get you going.
Dashboard widgets for Google Analytics
A widget is a miniature report that shows your data in a variety of presentation formats, such as tables, graphs, and straightforward numeric measurements. Widget definitions are available within the dashboard itself. One or more widgets displaying various metrics and dimensions may be present on a dashboard. There are two different widget kinds in Google Analytics.
Standard widgets
When you modify the date range or reload the page, standard widgets in Google Analytics update to reflect the new data. Here are some common widgets found on the Google Analytics Dashboard.
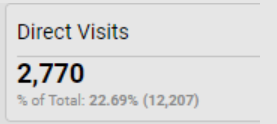
- Metric: displays a single selected metric’s basic numeric value.
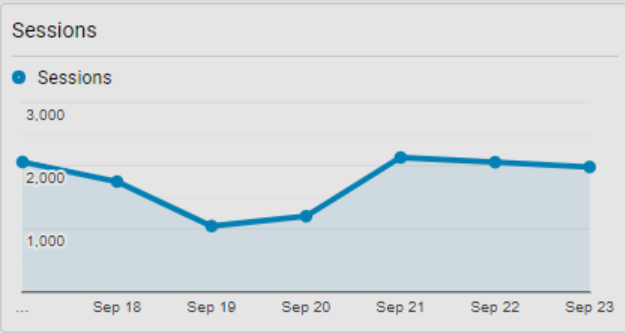
- Timeline: Shows a graph of the chosen metric’s evolution through time.
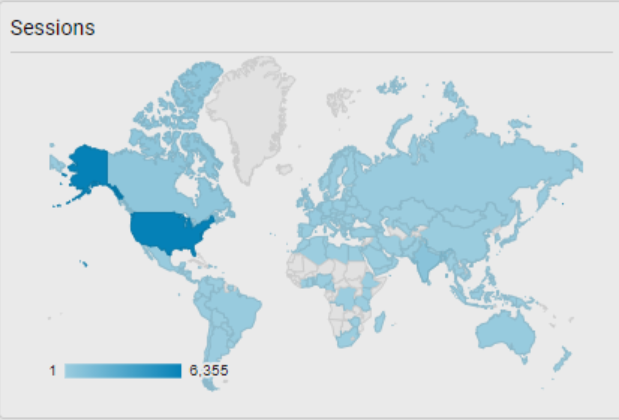
- Geomap: plots the supplied statistic on a map of the selected region to be displayed.
- Table : up to two metrics that describe the chosen dimension are shown, shown in tabular format.
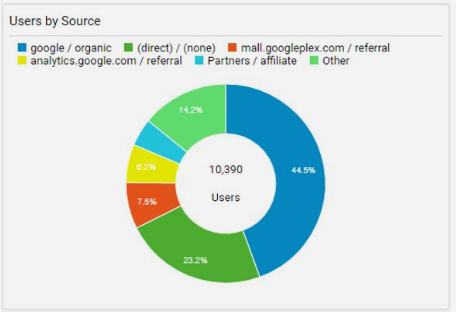
- Pie: Shows a pie graphic of the chosen measure organized by a dimension.
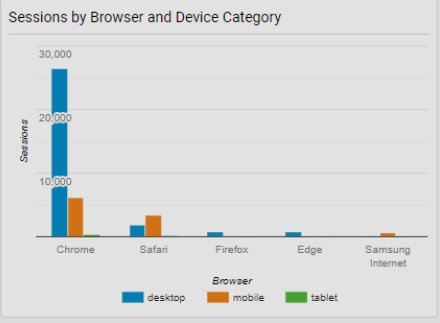
- Bar: a bar chart of the chosen measure grouped by up to two dimensions is displayed.
Real – time widgets
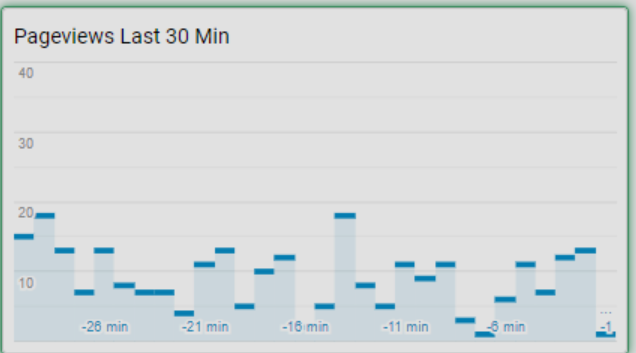
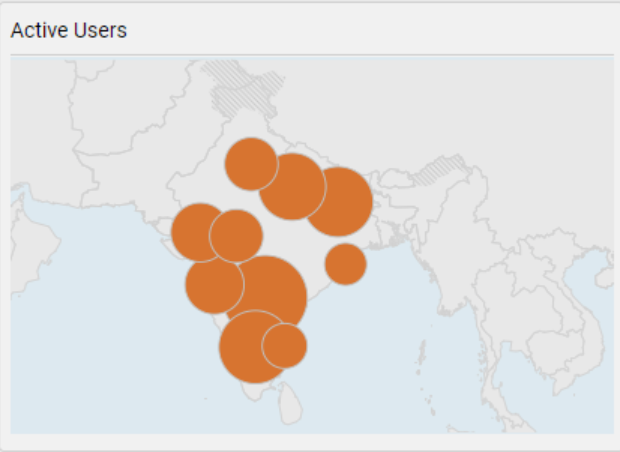
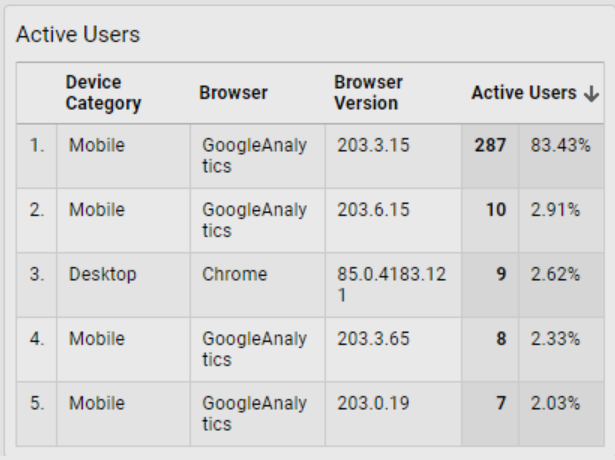
Data can be displayed in real-time using real-time widgets. For users who are actively using the website, these widgets automatically update the stats. Depending on the widget, real-time widgets can only show the stats for Pageviews or Active Users. The real-time widgets that are available are listed below.
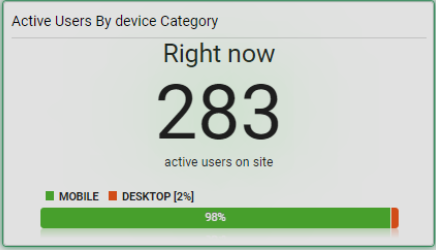
- Counter: shows the number of users who are currently logged in to your website. These users can potentially be grouped based on a chosen dimension.
- Timeline: shows a timeline graph of the most recent 30 or 60 second page views on your site.
- Geomap : shows a map of the geographic location of your active users. You can select to see active users by cities or by countries.
- Table: visualizes a table of your active users in relation to up to three chosen dimensions.
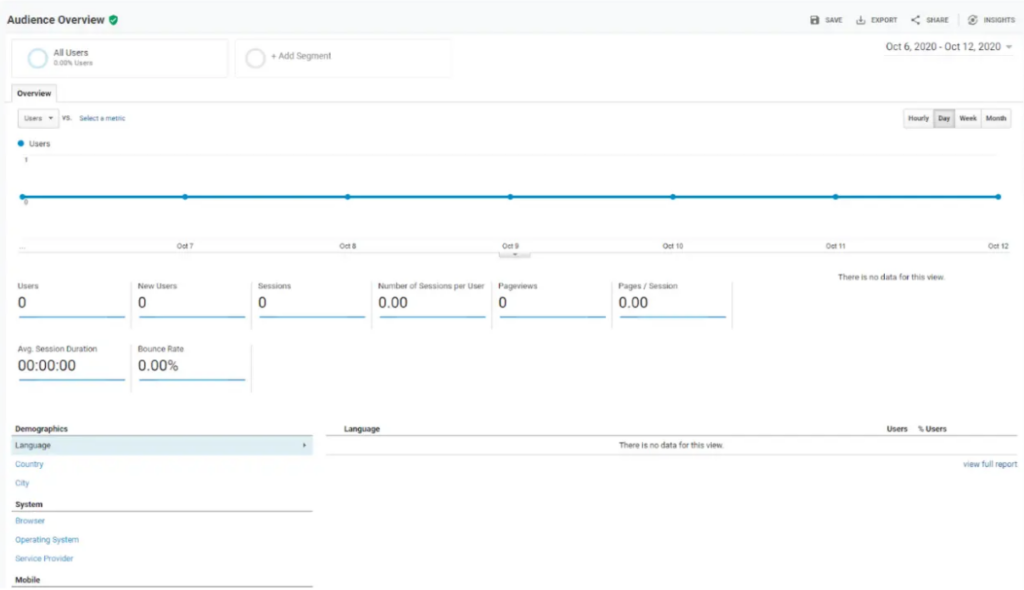
Audience overview
One of the most useful reports available through Google Analytics is this one. The audience reports give you details about site visitors based on characteristics important to your objectives and business.
This can include a wide range of factors, including important demographics (such as region and age), repeat consumers, and more.
Even more specific tracking of extremely niche categories of audiences is possible. For instance, you could keep track of website users who went to a certain product landing page and then came back four days later to make a purchase.
This knowledge is quite helpful for developing buyer personas, selecting blog post themes that might be of interest to your readers, and customizing your brand’s appearance for them.
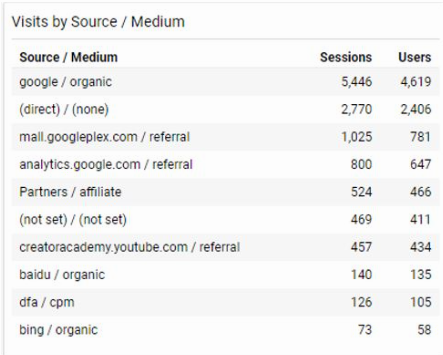
Acquisition overview
The Acquisition report reveals both the offline and online sources of your audience.
You can determine exactly where online visitors to a given blog article are coming from if you see that traffic to that blog post has increased. For instance, after doing some research, you can find that the blog post was put in a relevant Facebook group where people were particularly interested in it.
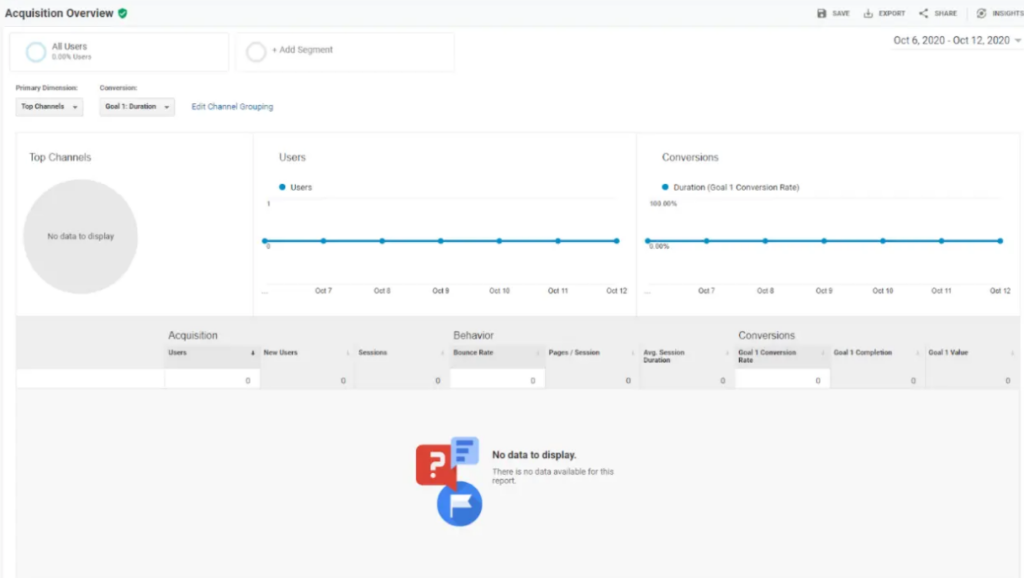
You may calculate the ROI of particular marketing initiatives with the aid of the Acquisition report, which is quite significant. For instance, you may monitor how many people are visiting your website from Facebook if you recently launched a significant Facebook advertising campaign.
This provides further insight into future social media and SEO marketing strategies.
Behavior overview
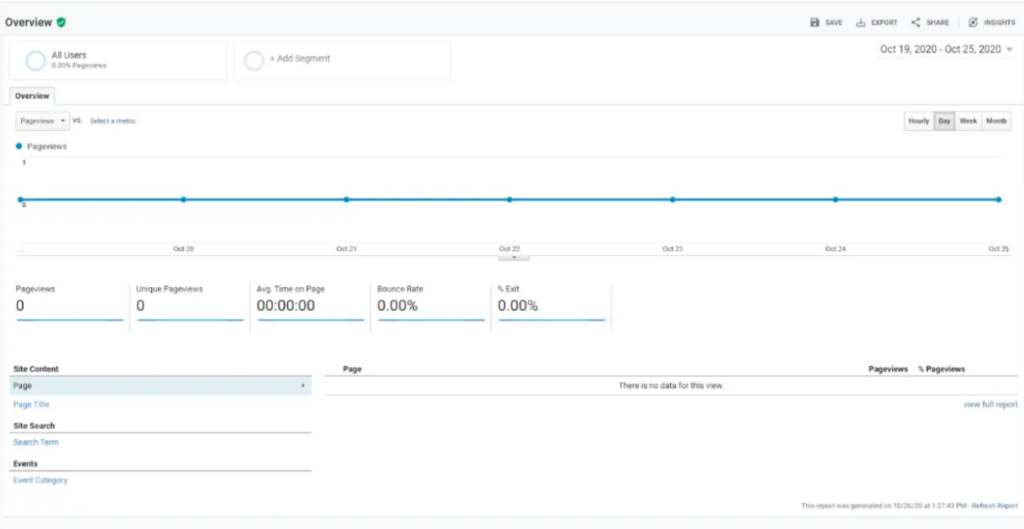
You can see in the Behavior report how visitors navigate and engage with your website. More specifically, it displays the total number of visitors to your site as well as the number of visitors to each of your website’s pages.
This breakdown can be very beneficial. It will reveal to you in detail, down to the individual web page, where your audience spends the most of their time while visiting your website. You may observe the “Behavior Flow” of your users by digging even deeper. This is a visual representation of the route that site visitors travel most frequently.
The user is tracked from the first page they regularly visit all the way to the final page they typically view before leaving.
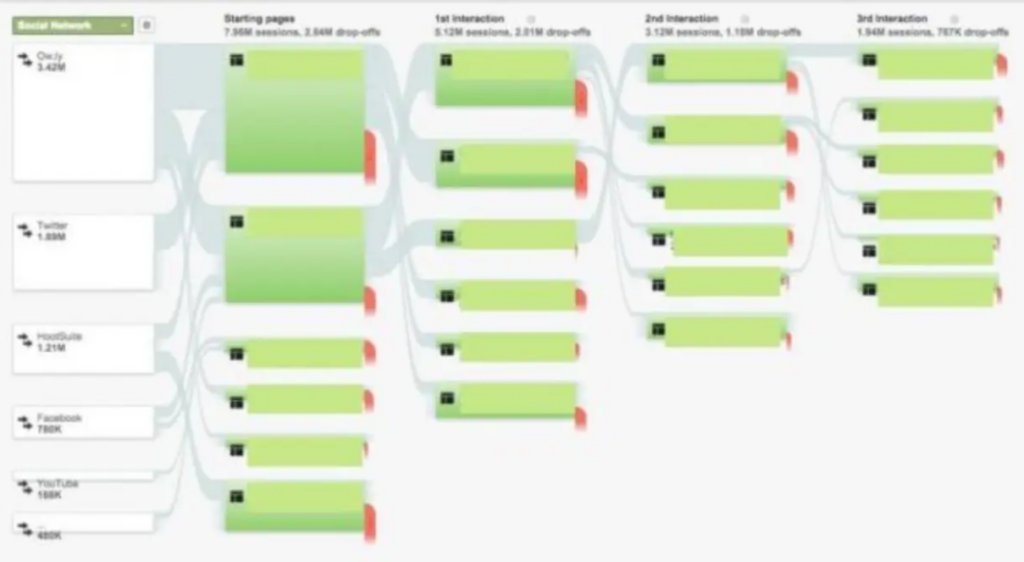
This might be a useful tool to double-check your impressions of how visitors will use your website. You can re-optimize your website to help direct visitors there if they aren’t following the path, you want them to take (for instance, if you want them to visit a certain landing page or a product page but they aren’t).
You can get a good analysis of each page individually from the Behavior overview. It displays the number of views those pages receive, the typical time visitors spend on them, and the number of unique page views. This is particularly useful if you’re using SEO marketing for your website.
Conversions overview
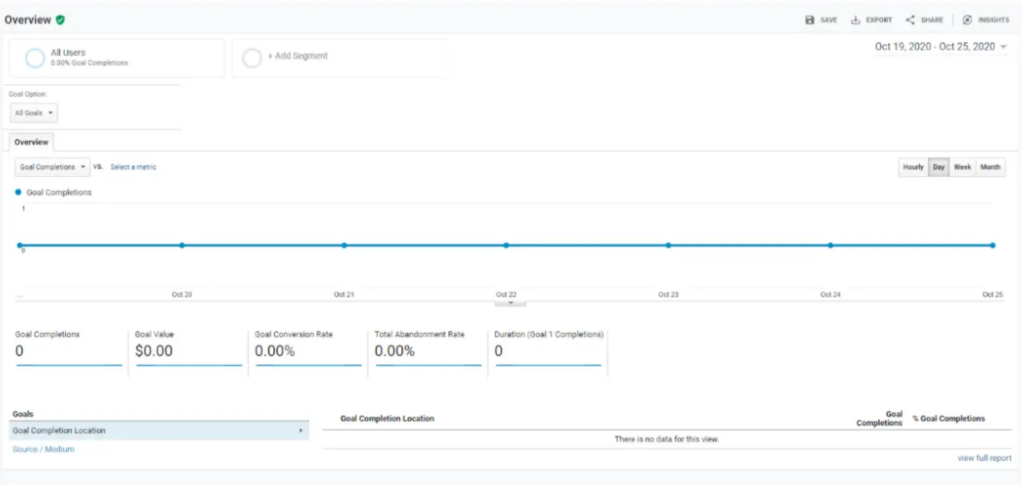
Here is where you can gauge the success of all your marketing initiatives. It displays your revenue generated from converting website visitors into paying clients.
The Conversions tab offers three distinct reports:
- Goals: This is a summary of how well your conversions and goals are doing. You may view the total number of completions as well as the dollar amount of each one. This report is essential since it allows you to calculate the value and return on investment of your campaigns.
- Ecommerce: pertinent if your website hosts an online store. It will display your product sales, payment methods, and inventory.
- Multi-Channel Funnels: shows you how several marketing strategies—including social media, landing sites, and advertisements—can be combined to convert visitors into paying customers. A customer might have made a purchase from you, for instance, after discovering your website through a search engine. However, they might have become aware of your company through seeing a social media reference you. This report aids in teaching you that.
In the end, I would like to get your attention about Google Analytic Versions:
- UA (Universal Analytics)
- GA4 (Google Analytic 4)
The differences between them are going to be summarized in
The measurements:
The measurements in UA Analytics are based on a session-based data model, as opposed to the G4 flexible event-based data model.
The reporting:
Limited cross-platform and cross-device reporting is available in UA Analytic, in contrast to full cross-platform and cross-device reporting in G4.
The automation:
While machine learning is used extensively in G4 to enhance and streamline insight finding, automation is limited in UA Analytic.
Conclusion
In conclusion, as we see in this article, Google Analytics Dashboard has a significant impact that will positively effects on how you can develop your own website based on the data that you can get using the Dashboard.
Manar Hasan
You may also like
Table of Contents Toggle Method#1: Convert image to a vector as Professional:Choose a vector graphics editor:Import the ...

Table of Contents Toggle But wait, what is an SSL Certificate?OK, so why do I need to get an SSL Certificate?How do I kn...

Table of Contents Toggle Page Title and Meta Description:Header Tags (H1, H2, H3):Image Optimization:URL Structure:Inter...

Table of Contents Toggle What is a VPS?Advantages of VPS hostingHow to choose a VPS providerSetting up your VPSChoose yo...
 Web Hosting
 Web Designs
 Graphic Design
 SEO
SEO Digital Marketing